New Farm. New Plan.
We purchased a new farm and with a new farm comes a new plan.
I want to document this journey and will start with the creation of a new farm plan. Planning could be as simple as drawing a layout on napkin but I was asked to create some topographic maps by a consultant in order to help us better understand the site.
About the site:
52 acres
2 ponds
3 creeks
1 wetland area
3 distinct parcels
The site is complex and I definitely think the aerial photos and topographic maps are going to help
Mapping your Farm 101
Step 1
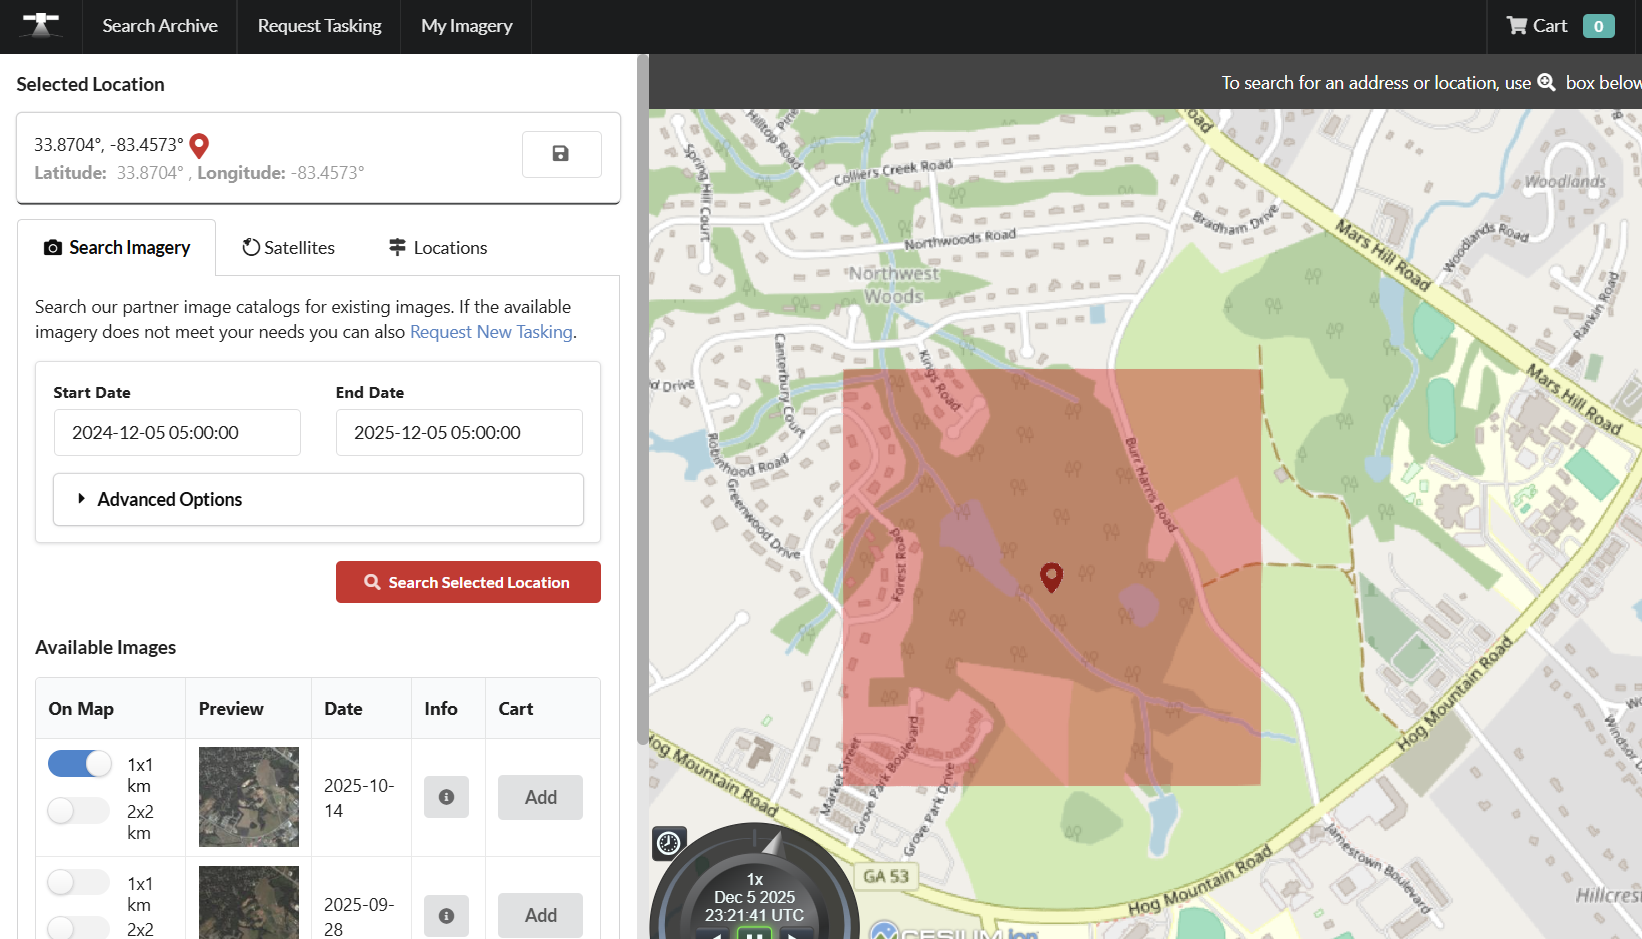
Click the Info button next to the date of the aerial you want purchase
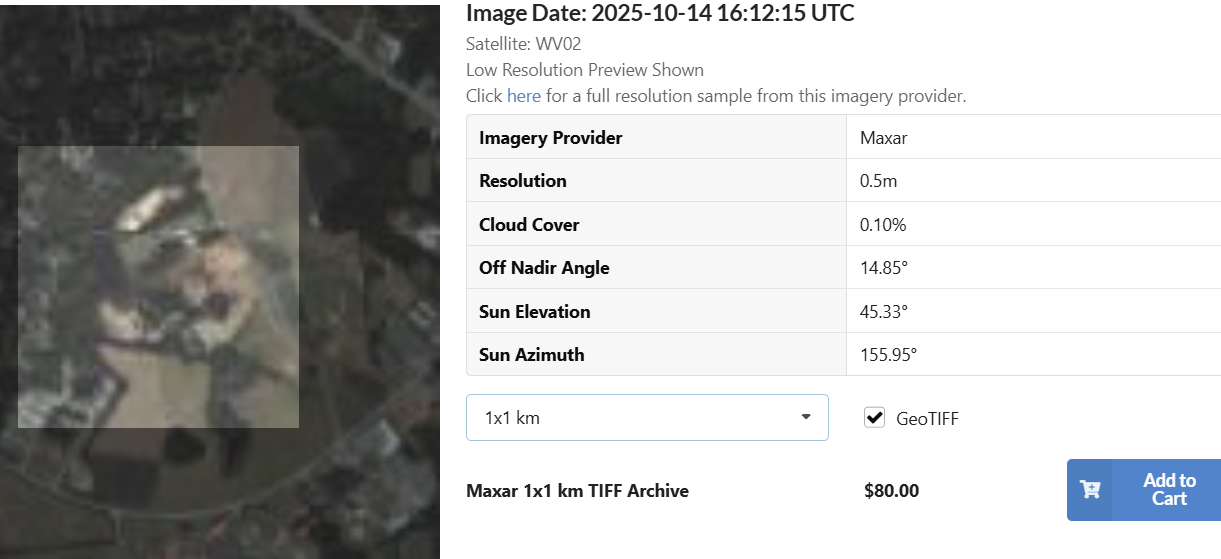
Make sure the area (1x1 km) includes your entire farm and make sure to select the GeoTIFF box. This will register the photo to the exact geographic coordinates when you load into QGIS (IE it saves a bunch of time) and will be $80 well spent. I’m sure there is a free way to do this but I couldn’t figure out how to get recent/high quality aerials. Leave a comment if you have a better way.
Purchase and Save the files.
Now open QGIS and create a new project.
Add your purchased GeoTIFF aerial to QGIS by Adding a Raster Layer
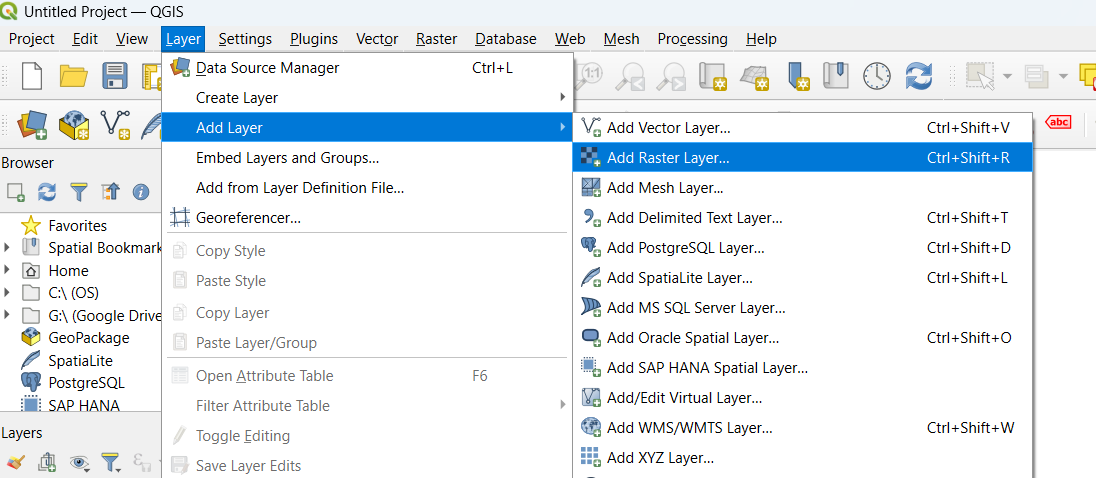
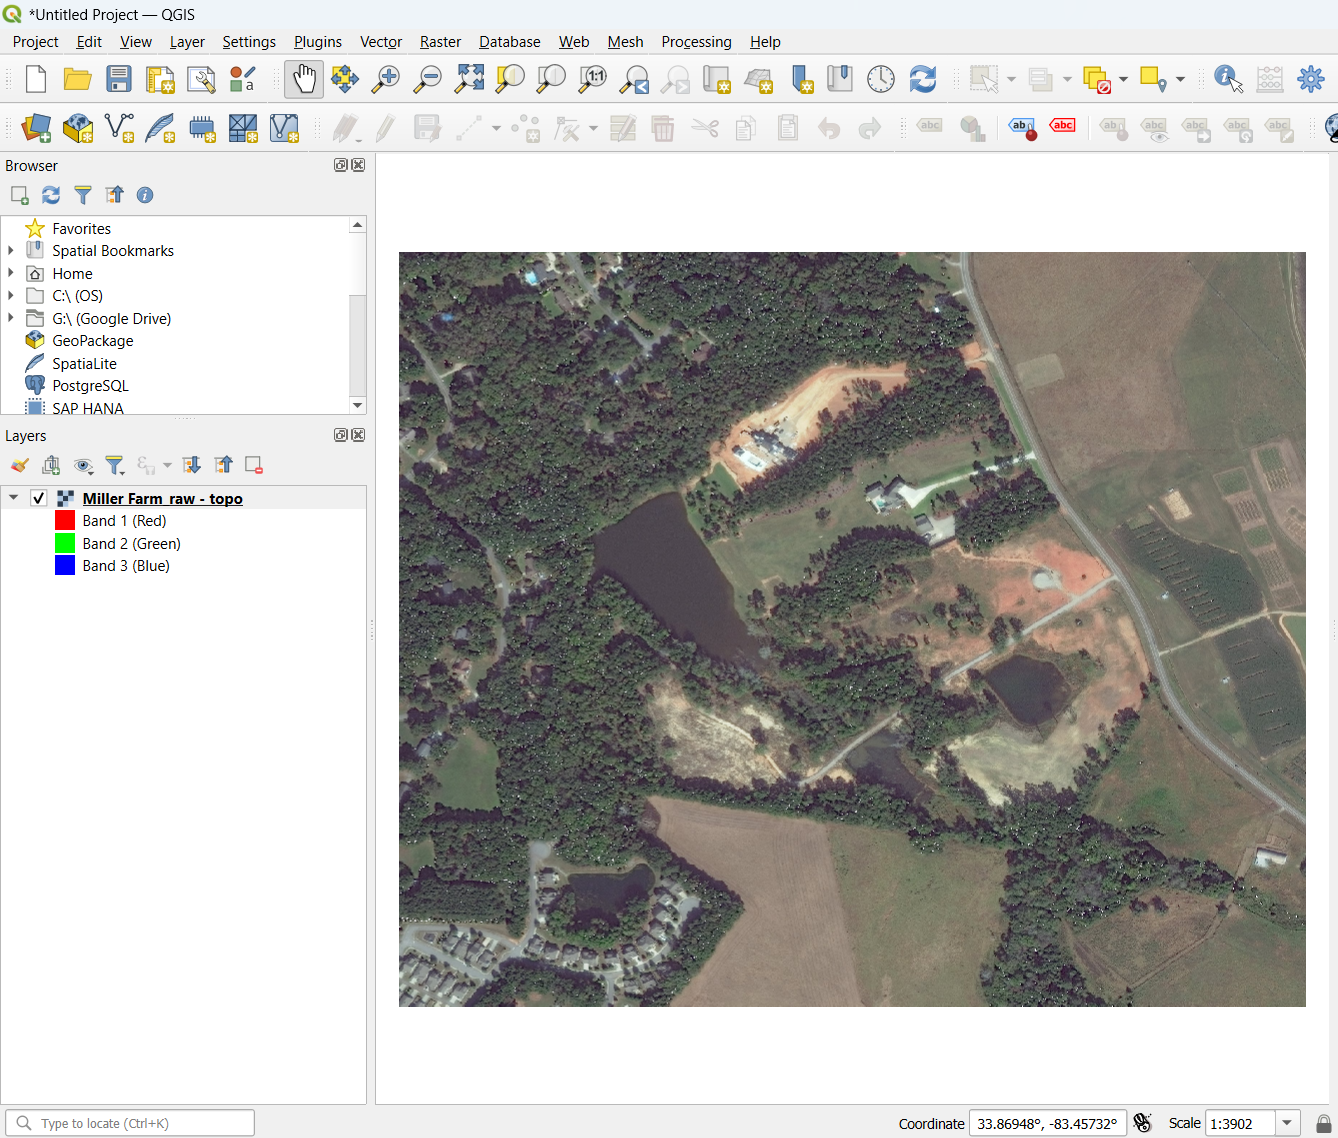
Select the .tiff file that you purchased
The aerial will load and you can see that it is registered to the coordinate by selecting a place on the map and confirming the coordinates are accurate (listed at the bottom of QGIS).
Ok now we get the elevation data.
Open a free account at OpenTopography.com. Make sure to use a .edu e-mail address if you have one. If you don’t then you likely need to get one because of some funding limitation that this service is hung up on.
Click Data —> Find Data Map
Search the map for your farm and the select region to highlight your land

I use the NOAA Coastal Lidar. I’m not on the coast but that data is available.
Click Get Point Cloud Data
At the next screen it is very important to only get the Ground (Class 2 Data). Click Standard Classifications and unselect Unclassified. Notice that this will drop off millions of data points. These elevation datapoints are trees! You do not want tree elevations on your topo!

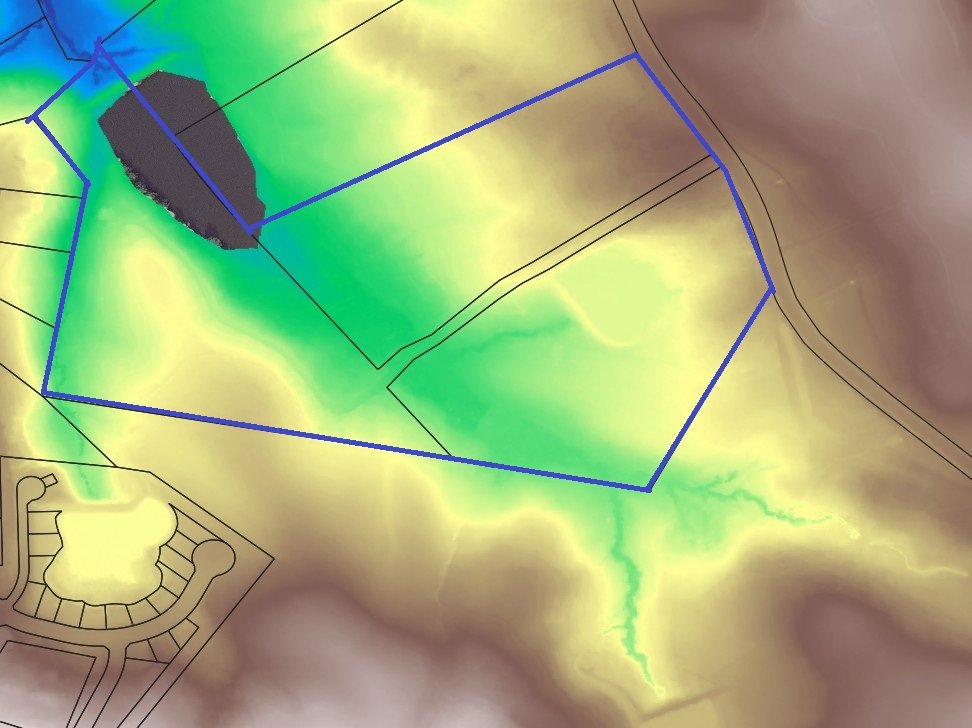
You can play around with the other raster visualizations. These selections like HillShade create additional .tiff files that you can load into QGIS
Save these files and load them into QGIS by Adding another Raster Layer (like we did with the aerial photo).

Now what? Now lets make some contours!!
Select the output.tin layer (Lidar data). Then Click Raster -> Extraction —> Contour
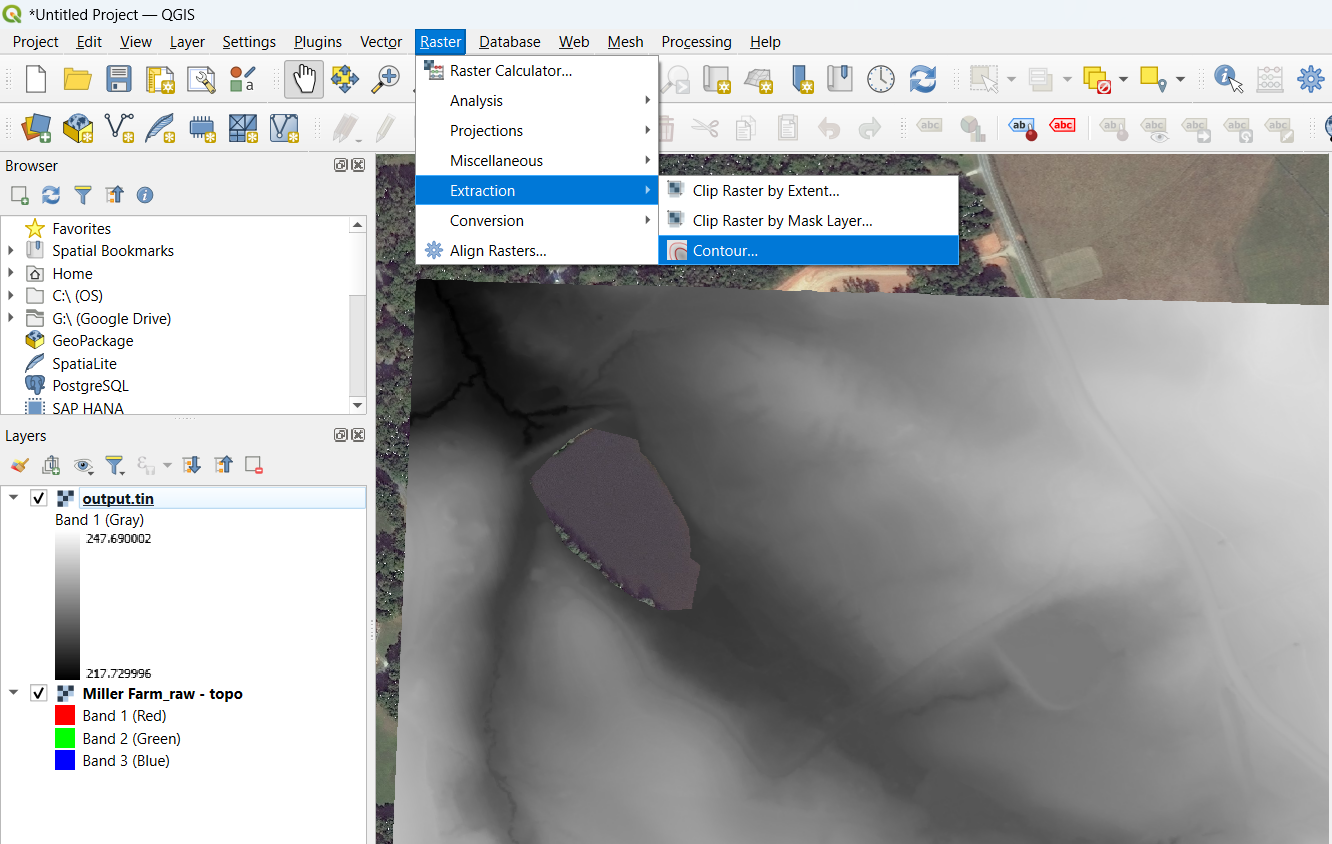
I made the Intervals 1.00 and then clicked Run

Now unselect the output.tin layer and right click Contours layers for properties to make the lines whatever color and thickness you want (I did brown and 0.5)

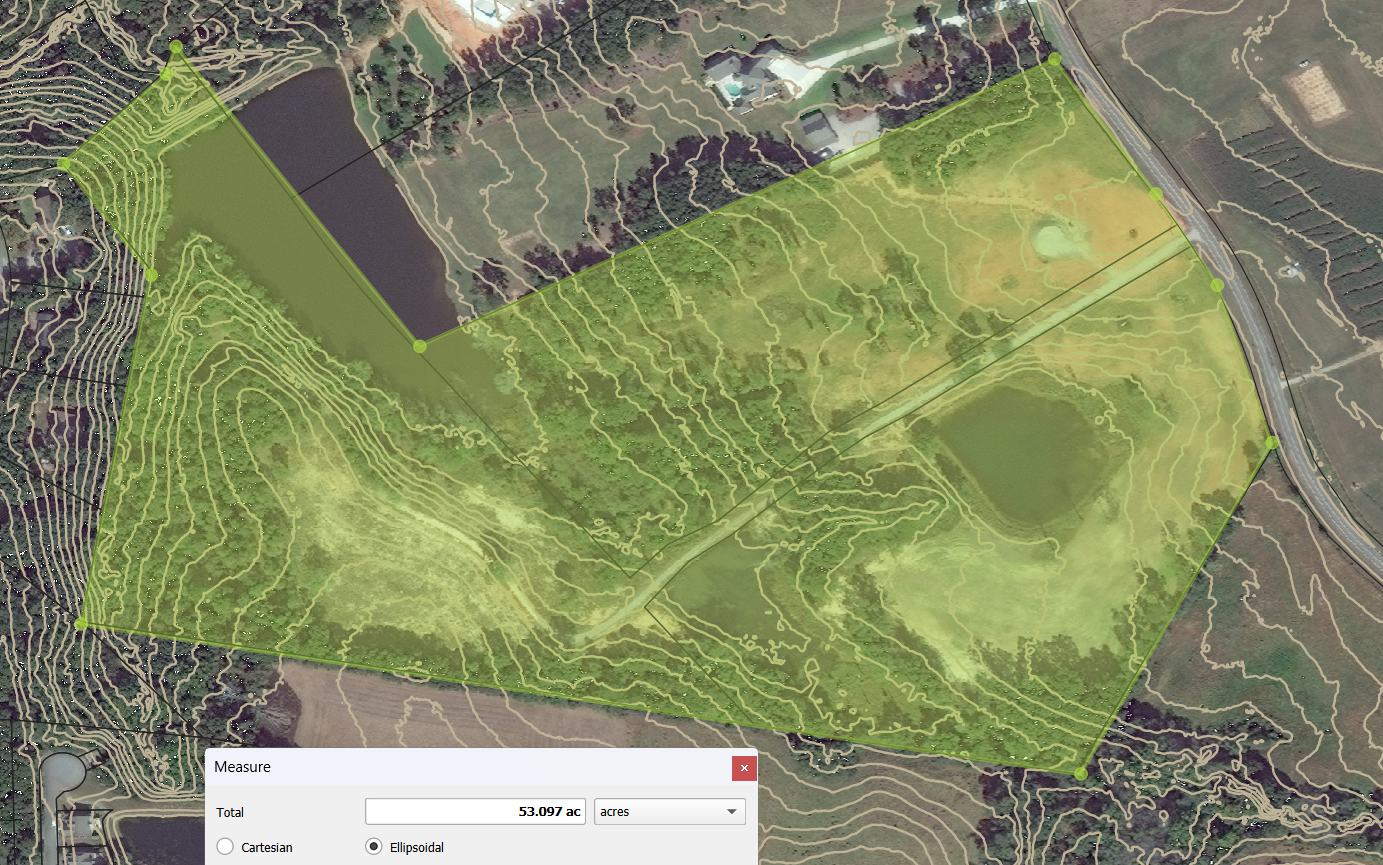
You can be done here or you can add property line data from you county GIS website. This is basically a vector data file (.shp) and you load it as a vector layer. After you load it you can make it transparent fill in the properties section to just see the property lines

Now you can play around with the other features of the program!
Use the Measure tool to measure area/distance/etc
I hope you enjoyed this QGIS primer!
Step 2- Soil Testing!- coming soon